Why we wrote an Excel parser in house
A look under the hood at how Andera reads raw evidence and produces workpapers your auditors already trust.

On an all-nighter in Amsterdam, sitting in a bare hotel room with just a hard metal chair and an equally uncomfortable bed, version one of excel_service.py was written. These first 6,000 lines of handwritten code were the beginning of our journey into the depths of OpenPyXL, a library used by millions for Python Excel automation. This addition allowed us to reason over images and embedded files in a way that no other tool on the market supported.
Over the next year and a half, OpenPyXL would be dissected, modified, and eventually gutted as we built an internal engine that can read Excels 100x faster and 1000x more memory efficient than existing open source alternatives. This project posed some of the largest trials, tribulations, and ultimate successes that we had on what has been one of the most fun engineering projects I have worked on.
Death by a thousand Excels
Gaining customer trust is hard, and maintaining it is even harder. We had just spent the past three months reaching out to auditors in all industries, and had finally gotten a customer to trust us with their most sensitive data. This was done under the promise that we would deliver tools to them that would automate all of their complex audit work. If we failed, we would need to begin the arduous search for someone willing to extend this level of trust again.
This customer was feeding us data dumps that consisted of thousands of scattered email threads, contradictory PDFs, and gigabytes of complex Excel files with millions of rows of data, unorganized images, and text scattered throughout.
From day 1, we were expected to be able to reason over billions of tokens of out-of-distribution data in an industry where mistakes are not tolerated, and any hallucination is seen as a breach of trust. We immediately used a host of providers to help with parsing almost all complex data, but there was no product on the market that could effectively parse Excels. Open source alternatives existed, but both those and simple internal tools were not sufficient to give our agents a convenient way to read, interpret, and understand the complex Excel workbooks we were receiving.
To make matters worse, while we were spending night and day trying to figure out how to process one Excel, clients conveniently let us know via a new data dump that our agents need to be able to reason over hundreds of workbooks that all depended on each other. Subtle representation issues in the way we processed one Excel would cascade into intolerable accuracy errors over the whole corpus.
We were surprised that a model which could write beautiful code seemed completely lost when it encountered even a mildly complex Excel. We knew that models would continue to scale, so for any engineering effort we put into this task to remain durable, it would need to be invested in data representation. Without access to an optimized, structured set of primitives built for Excel, truly frontier performance is impossible; it seemed that no one had made real, compelling progress on this task.
So, with clients expecting results, data piling up on our hard drives, and a problem in front of us that no one had solved before, we rolled up our sleeves to build an Excel engine in-house.
Standing on the shoulders of giants
It goes without saying, but we did not start out wanting to build our own Excel parser. If there was a tool that solved our problem, we would have preferred to start with that.
For our use case, we needed to be able to:
- Faithfully read an Excel in its entirety
- Robustly modify an Excel by adding annotations, textboxes, images, and content to cells
Given architectural decisions, we knew that we'd be hosting our application on Linux machines. This ruled out libraries like xlwings and others that relied directly on Microsoft's Component Object Model. We also didn't think it made sense to add auto-scaling Windows instances just to support Excel, since our other data formats (like PDFs) fit much better into Linux architectures. Linux provided a stronger ecosystem for parsing most data formats, and it seemed prudent to have all processing done on the same machine to aid in inter-document reasoning.
After perusing the open source ecosystem, we settled on using OpenPyXL as our initial way to read Excel files. It had solid documentation, generally positive reviews, and was OS-agnostic. We had also heard that most post-training efforts at frontier labs were built on top of OpenPyXL, so it seemed logical to build with the tools models were already familiar with.
However, we hit snags as soon as we began developing with it. Our contracts rested on us being able to extract and interpret all types of images from Excel, but OpenPyXL did not faithfully extract this data.
Filling in the gaps
OpenPyXL was quite clear in its documentation that it did not support all types of image extraction. However, surely if the library supported one form of image extraction, it wouldn't be that hard to extend functionality further. Surely…
What proceeded was a dive into the confusing decomposition of Excel under the hood, and the various ways that Excel tried to retain dimensional integrity for images as pages got resized.
There is unfortunately very little good documentation about how Excels actually work. The official multi-thousand-page documentation is almost impossible to follow, incomplete when describing how Excel worked on non-Windows operating systems, and at times misleading about Excel's behavior. Instead, the behaviors we had to patch were discovered by translating Chinese GitHub repos, digging through tremendous Stack Overflow posts, and drawing on community efforts to demystify Excel; when those failed, we used tools like Bit-Slicer to investigate how certain actions affected values in Excel's virtual memory.
Excels are really just folders of XML documents. When decomposed, a standard Excel can look like this:
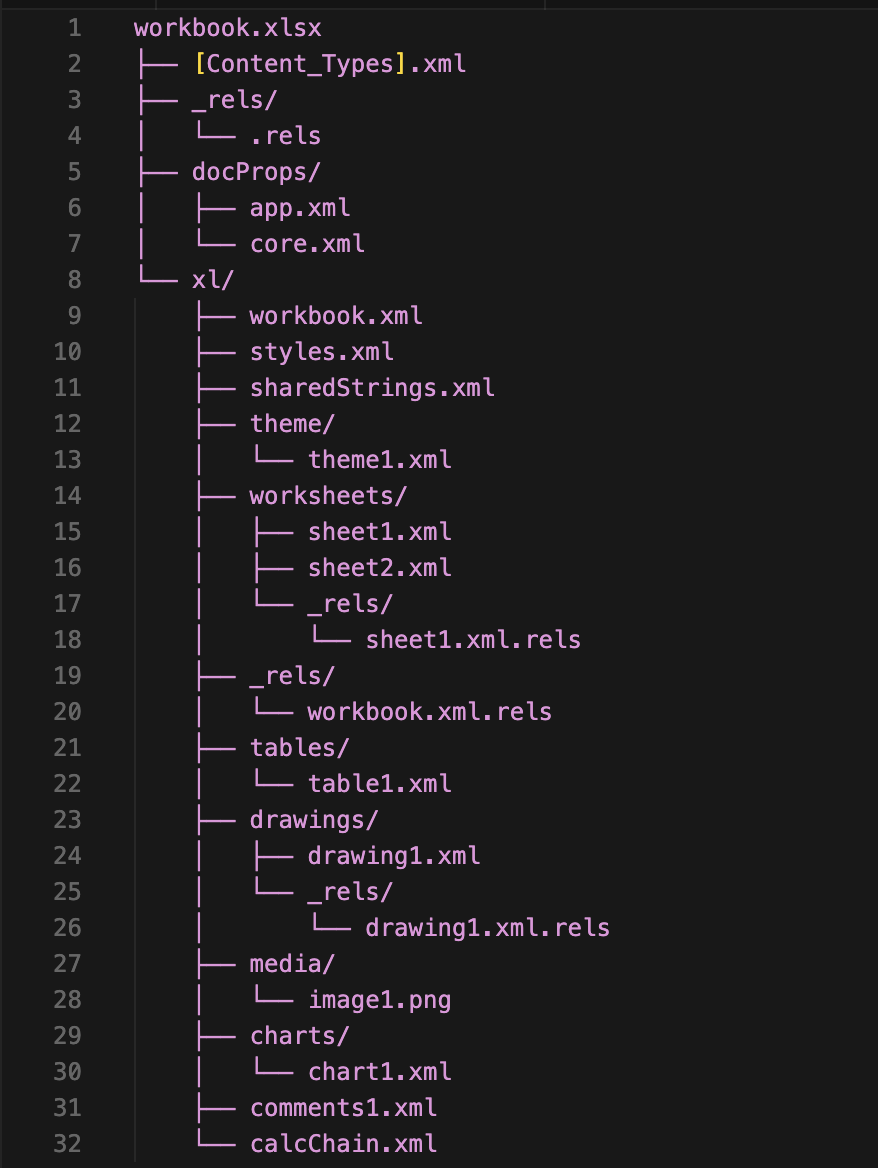
All core information is stored in the xl folder. But, to read something like media, you need to tie information together from multiple subdirectories.
Images
In Excel, in order to find all information about where an image is located, you need to:
- Identify on an XML sheet if there was an associated drawing element. If so, make note of the relationship ID that the drawing file referenced.
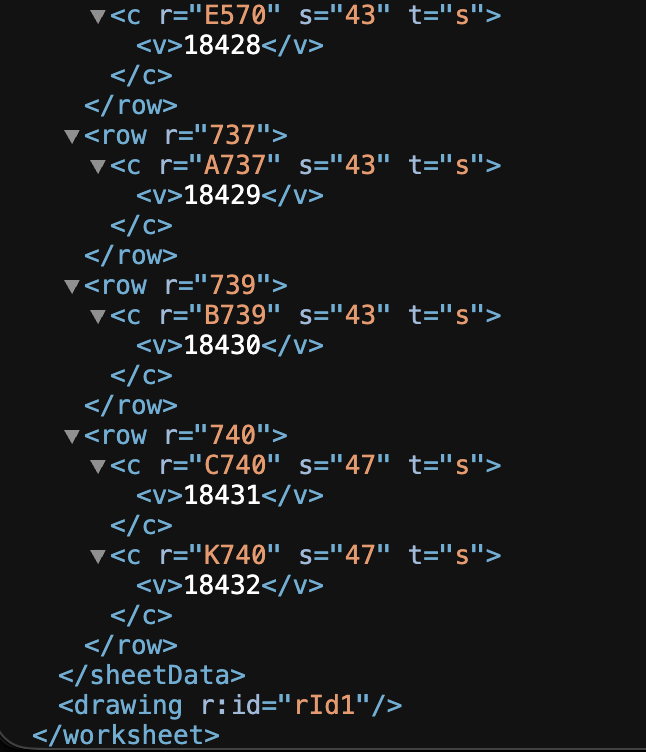
- Using that relationship ID, navigate to that sheet's associated
sheet.xml.relsfile, and identify what the associated drawing file that this sheet uses is.
- Navigate to the drawing file. Each image will either be a one- or two-cell anchor which will give you information about how it resizes itself when row heights and column widths are altered. Each image may also be enclosed in an
<xdr:grpSpPr>tag. Values within this tag are for an affine transformation on the image, changing the scale of how an image is rendered while also changing where (0,0) is relative to the image. While strange, this was implemented so that users could embed images within shapes, and upon resize, have the image resize appropriately.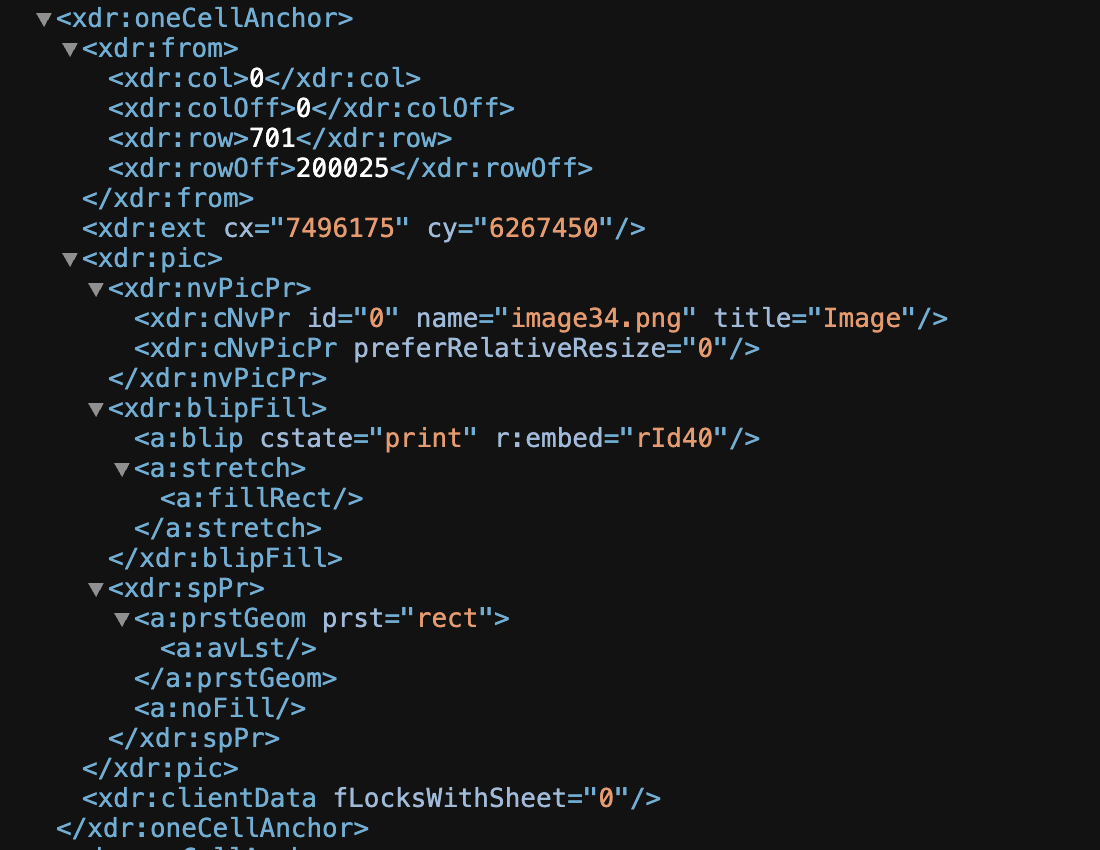
- If you want to be extra careful, use the
r:embedtag to locate the image's relationship XML tag in the associateddrawing.xml.relsfile.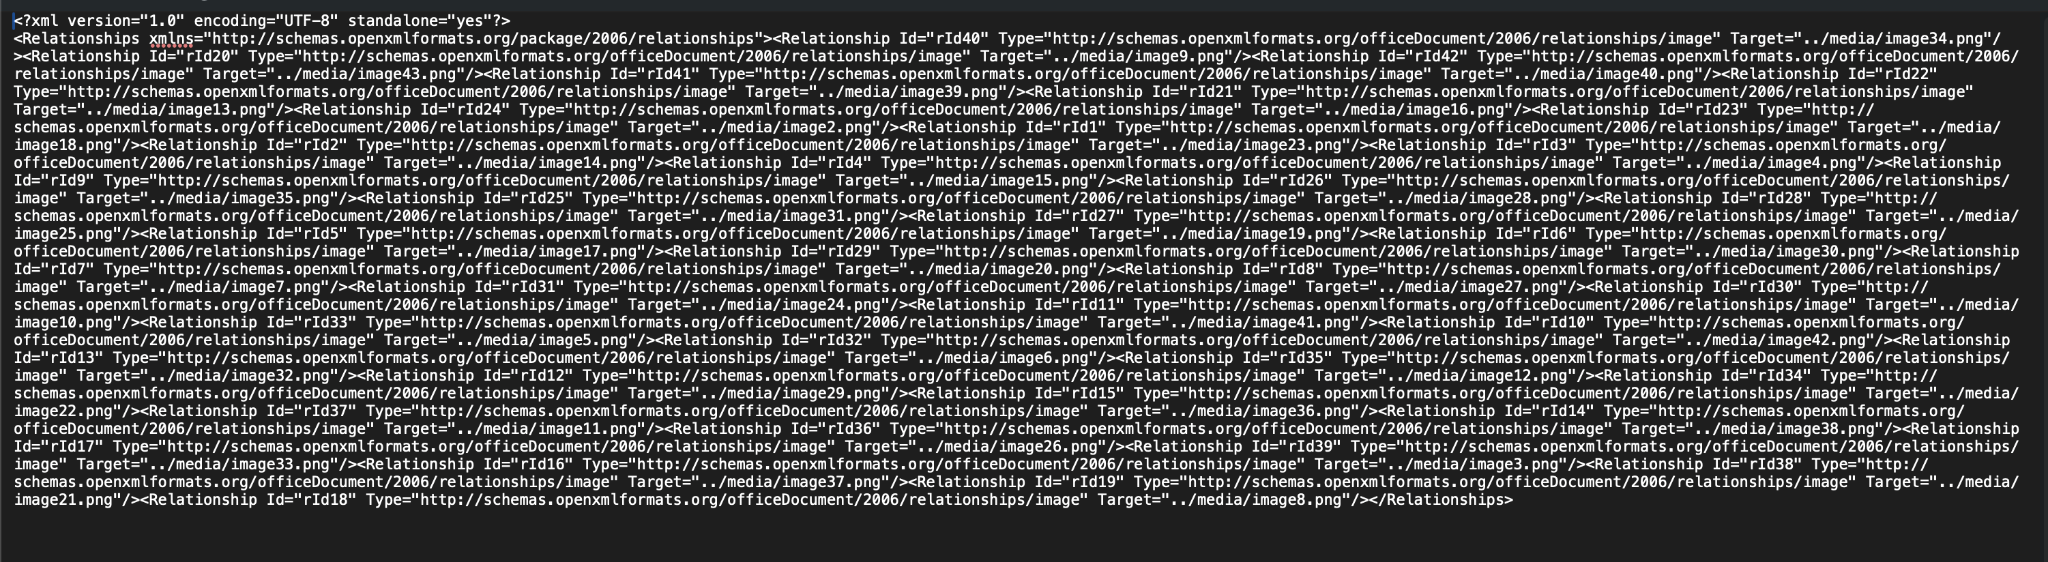
- Finally, using that relative path, you can find the associated image in the media folder.
Similar processes were followed for capturing other pieces of data, including tables, hidden columns and rows, and Excel view panes. OpenPyXL claimed to support extraction of this data, but in large-scale tests we noticed that most of these features had problems with their extractions.
Given the specificity of the task, we realized that the models we were using back in 2025 struggled to write high-quality code for parsing Excel XMLs. Agent loops at the time were not able to patch these edge cases without another problem popping up elsewhere. Since accuracy was everything for us, we decided to write this section of the codebase by hand, resulting in ~20,000 LoC sitting on top of OpenPyXL.
The writing problem
Data ingestion was only half the battle. While we were building our scaffolding on top of Excel, we had the unfortunate realization that OpenPyXL did not support writing to Excel with the degree of customization we needed. So, we went searching again for tools that could solve this part of the problem.
Fortunately, XlsxWriter seemed to accomplish 90% of the Excel writing tasks we wanted to do. It supported adding drawings and text boxes to sheets, it gave us basic sheet editing controls (adjusting columns, rows, etc.), and it had a relatively intuitive feel.
There were two places where we had to extend functionality:
Adding arrows
XlsxWriter supported adding rectangular drawings, but didn't support shapes beyond that. As per usual, it was extremely difficult to use the official docs to understand all the nuances that Excel used to construct arrows.
A significantly simpler strategy turned out to be creating multiple Excels with arrows on them, git diff'ing them, and piecing together how Excel adjusted arrow parameters in various situations.
Writing images
When comparing Excels we made by hand to Excels that we tried to recreate with XlsxWriter, we noticed that rendered images ranged from being slightly awry to disastrously out of proportion. After reading through the source code of XlsxWriter, we hypothesized that the library made simplifying assumptions about how to take an image's DPI and an operating system's "base" DPI to affect how an image would be rendered on an Excel. For standard images, these assumptions were fine, but when images got cropped or scaled, these errors compounded.
We built a system that could read hundreds of images, place them on an Excel, and compare image dimensions in inches of the input image to the rendered image. A few learnings immediately fell out:
- Although Macs typically work at 72 DPI, if they are in retina mode, they will functionally behave as if they are in 144 DPI. Images will be half the size if not addressed.
- Excel has a fixed DPI that it uses for image rendering. Our solution to adjust for higher DPI images was to do crop and rotation math assuming the image was in Excel's fixed DPI, and then apply appropriate scaling to get the image to render in the intended dimensions.
Performance issues
With both reading from and writing to Excels solved, we felt on top of the world. However, as we continued to move upmarket, our larger clients put a damper on our spirits when they showed up with volumes of data that seemed impossible to me that a human previously had to go through by hand.
We immediately noticed that network traffic within our application was skyrocketing on larger data volumes. To load one workbook, at times we would observe gigabytes of data flow — not fun for us or our instances when we had to load hundreds of documents at a time.
Running a profiler quickly identified that the network traffic was largely consumed by the data format that we used to represent Excel cell data, which, in the worst case, could balloon to over 70GB for one Excel.
In our initial data model, we stored each cell as a Pydantic object. We noticed that object validation was incredibly expensive when it was being run potentially tens of millions of times on each Excel. Investigating, we learned that the memory overhead of a Pydantic object is roughly 60x that of what the data is in a C-struct. Switching to slotted data classes dropped the memory footprint to roughly 5x that of a C-struct. Now, rather than transporting ~70GB of data over a network, we were down to ~6GB. Still unbelievably large.
Excel utilized a concept of shared strings to reduce the size of a workbook, so we decided to adopt something similar: rather than having sheet data being represented as a list of lists, we represented it as a dictionary mapping each cell without its coordinate to a list of all the coordinates where it appeared.
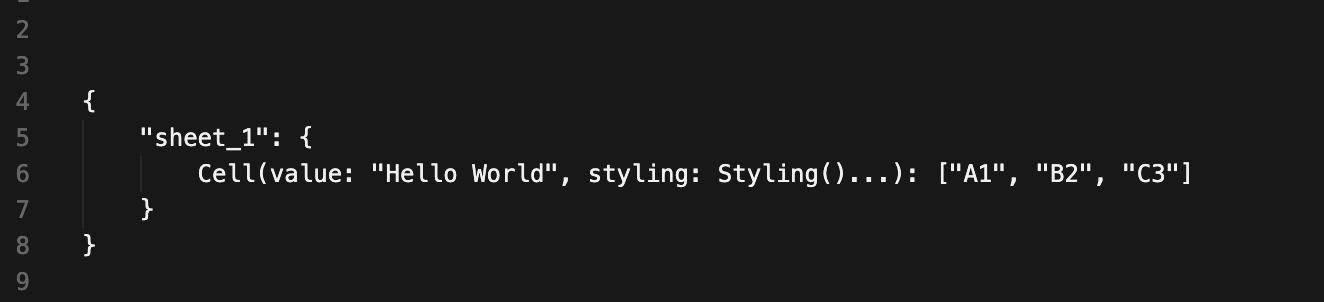
After switching to this data format and applying light compression, we were able to get the package size down to ~100MB in the worst case. Eventually, further data optimizations allowed us to get that down to 10s of MBs.
We tried many optimizations to convert between our dictionary data format and a list of lists, eventually resulting in us writing a converter in C that would utilize all of a computer's cores to reduce processing time as much as possible.
Whew. Coming up for air, we saw that Excels that previously used to take 2 hours to load were now loading in less than 1 minute.
The auxiliaries
Every system can always get better, and when improvements to this system directly result in our agent performing verifiably better on the most complex long-horizon tasks we are given, we are incentivized to seek perfection in performance.
The scaffolding around OpenPyXL eventually became so massive that it made sense to rewrite OpenPyXL entirely in house. Additionally, while XlsxWriter had a good run powering our writing engine, eventually, it was time to shelve it for an internal engine that could write orders of magnitude faster and support complex macro-enabled Excels.
Excel has now existed for over 40 years. Each new version introduced new ways it handles data, new primitives, and more layers of complexity. Every day, there is a new experiment to run to try to reverse engineer what exactly Excel is doing. We've built OS-agnostic font rendering engines to get pixel-perfect Excel width placements, custom ASTs to resolve formula changes in Excel instantly, and an alias system to allow agents to write Python code to interact with Excel objects, when they are really DB objects.
Every day has a new challenge that requires creativity, a broad understanding of what technologies we have at our disposal, and an exceptional ability at figuring out what the right question is to ask after a new brick wall is hit.
And this journey is not one that I had to walk alone. In addition to the amazing team at Andera that delivered some of our most significant breakthroughs, it also felt like we were part of a global treasure hunt with people from all corners of the world trying to demystify how Excel works under the hood. Blogs would be published to dissect how exactly fonts translated to column widths, repos would exist to reproduce specific Excel idiosyncrasies, and decade-old threads would be filled with people documenting their observations when trying to unmask the complexities of Excel.
Conclusion
After over a year of working on this problem, we've built systems thinking they were perfect only to lovingly discard them when we are able to push performance even further. What remains is roughly 43,000 lines of code written to give us the functionality of something we thought we could just pip install.
Every step posed a new challenge that required a new problem-solving technique, and every day that I worked on Excel I woke up excited to have to think outside the box. In an age where LLMs can generate code with superhuman ability for most tasks, having to rely on my own devices was surprisingly refreshing.
Excels are one of the largest troves of economically valuable data that exist. Even with that, automation over these documents is primitive at best. While we are able to automatically parse simple Excels with tabular data, these make up only a tiny portion of the ways that this tool is used.
The Excels that come as just tabular data only account for a tiny fraction of all Excels produced. A person about to retire at a large public company could have spent their entire career keying values into Excel. This person is not a machine. They would have keyed values in when focused and misentered numbers when tired. They would have been entering data while getting distracted on a call and frantically repairing a sheet after deleting key data. They were one of many people at the company who added their own imperfections to the data. We now look at this document that has spanned multiple decades, has seen multiple recessions, multiple accounting standards, and multiple employee turnovers, and we expect our tools that parse tabular data to understand this.
It simply doesn't work. To reason about data that is as complex, nuanced, and broken as this, systems must be designed to think like a human.
We are actively recruiting the smartest and most driven engineers to join a team that has already built the most powerful Excel engine in the market. Whether you specialize in agents, systems, or product, if you are excellent at your craft, there is a place for you at Andera.
Browse our open roles or email aryo@andera.ai — we'd love to hear from you.